
.svg)
.svg)
.svg)
Ever feel like sales forecasting is just a guessing game?
You’re not alone. Many businesses struggle to predict revenue, plan budgets, or even hire confidently—simply because their sales forecasts are based on guesswork instead of good data.
But here’s the thing: you don’t need to be a data scientist to get it right.
With the right sales forecast template, you can turn raw numbers into real insights—without hours of spreadsheet chaos.
And if that sounds like too much work already, we’ve got good news
In this article, you’ll get access to 10 practical sales forecast templates, plus smart tools that help you automate and stay on track. Whether you're a startup founder, sales manager, or solo operator—this guide will make your forecasting faster, easier, and more accurate from day one.
What is a Sales Forecasting & What Problems Does It Solve?

Sales forecasting helps you estimate future sales so your business can plan better. It’s not just about numbers — it’s about making smart decisions with real data instead of guesses.
Let’s break it down into key parts to understand what it really is and the problems it can solve for you.
Types of Sales Forecasts
A sales forecast can be built around time, team, product, or even channel. Here are some of the most useful types you’ll come across:
- Time-Based Forecasts: These include daily, weekly, or monthly sales forecasts. They're great for spotting trends.
- Territory Forecasts: Useful for companies selling in different regions or retail stores.
- Product-Based Forecasts: Focused on predicting units sold per product or service.
- Rep or Team-Based Forecasts: Tracks performance per sales rep or full sales teams.
Some businesses also use sales projections to plan for best-case, worst-case, and expected outcomes — especially when tracking future sales revenue.
Sales Forecast vs. Sales Goal: Know the Difference
Many people mix up a sales forecast with a sales goal, but they serve different purposes. Knowing the difference can help you manage your team and expectations better.
Sales Forecasting Methods: Types, Comparison, and How to Choose the Right One
Sales forecasting methods help you turn data into decisions. Choosing the right one depends on your business model, sales cycle, and available data.
Here’s a quick comparison of the most common sales forecasting methods to help you understand what each one offers.
Picking the right method depends on what you sell, how you track deals, and how much data you have. Here’s how to make the best choice:
- If you’re just starting, use historical forecasting or intuitive forecasting with a free sales forecasting template.
- For teams with a working CRM, pipeline forecasting or opportunity stage forecasting gives more control.
- If you need to project future revenue more accurately, try multivariable forecasting.
- Use sales forecast templates to test different methods and find what fits your sales process.
- Always match the method to your team’s size, product type, and how long your sales cycle is.
10 Ready-to-Use Sales Forecast Templates (With Real Examples)
Sales forecasting gets easier when you have the right templates. These ready-to-use options can help you stay organized, save time, and improve how you track and plan your future sales.
Below are 10 practical sales forecast templates — each designed for a different type of business or sales need.
1. Basic Sales Forecast Template
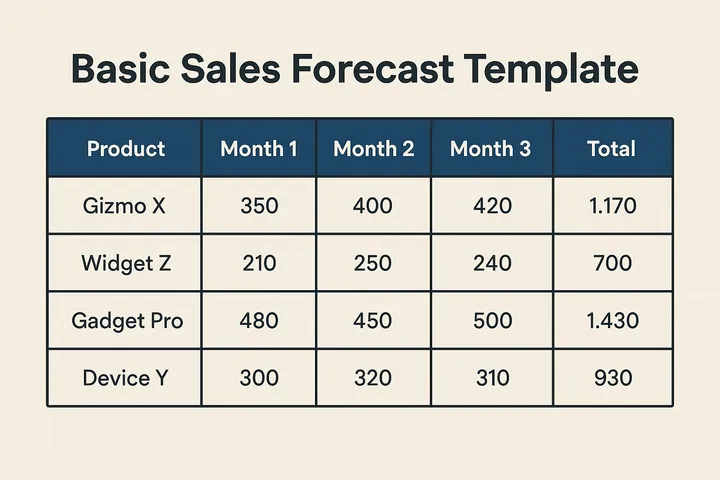
This template is perfect if you're just getting started with forecasting. It gives you a simple way to track key data like product names, units sold, dates, and projected revenue. There's no automation or formulas — just a clean table that’s easy to edit and understand.
It’s especially useful for solo founders, small shop owners, or anyone new to the sales forecasting process.
Features:
- Easy-to-edit layout with clear labels
- Columns for product, date, units, and revenue
- Works offline in Excel or online in Google Sheets
2. Monthly Sales Projection Template
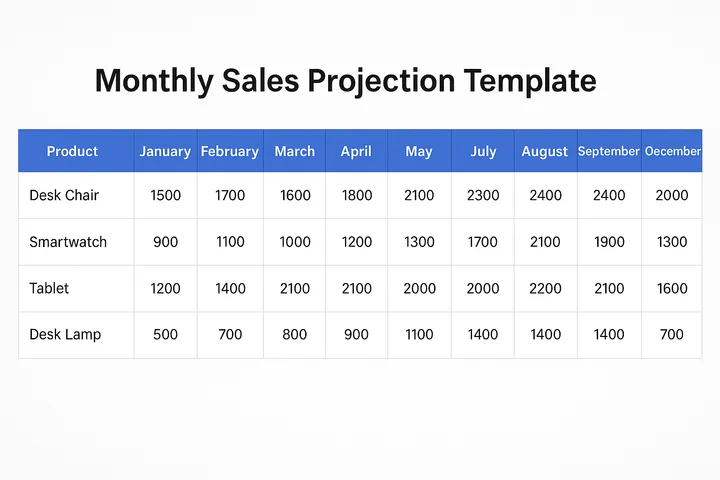
This template is made for businesses that track their performance month by month. It helps you break down your sales targets by month and compare them with actual sales figures.
You can also use it to spot slow months, seasonal patterns, or trends over time. It's ideal for sales managers who need to keep the team aligned with monthly revenue goals.
Features:
- Monthly breakdown with goal vs actual columns
- Auto-calculations for totals and variances
- Great for visualizing performance across the year
3. Free Sales Forecast Template (Google Sheets)
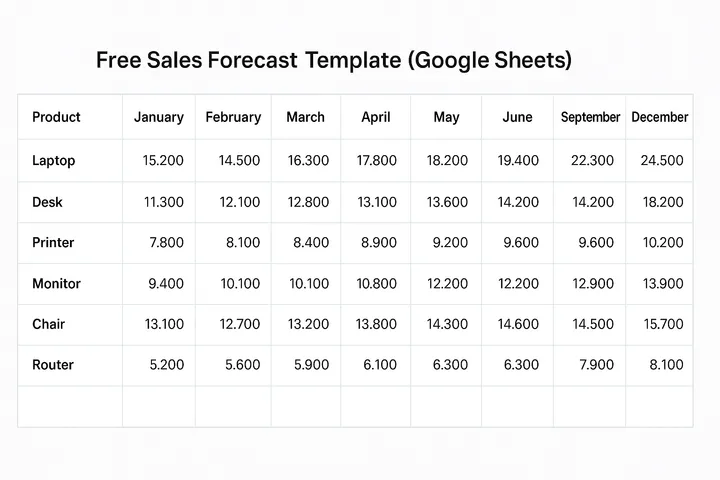
If you want something flexible, collaborative, and free — this is it. The Google Sheets template is built with formulas, so totals and projections are calculated automatically.
You can easily share it with your team and update it in real time. It’s a great option for small businesses or remote teams who prefer cloud-based tools.
Features:
- Built-in formulas for sales and revenue projections
- Live collaboration and version history
- Can be customized for different products or services
4. Retail Sales Forecast Template
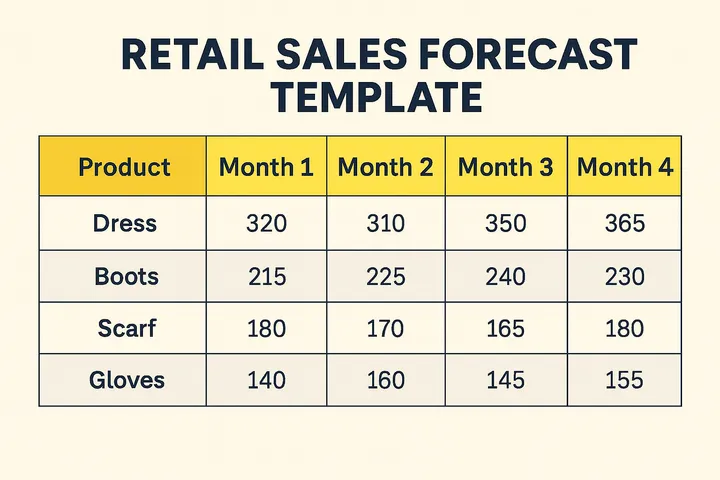
Retail stores need to know how much to stock and when. This template helps you forecast sales based on past performance and upcoming demand.
You can enter products, categories, pricing, and units sold — then adjust based on seasonality or promotions. It’s perfect for store managers, franchise owners, or ecommerce brands with multiple SKUs.
Features:
- Product- and category-level sales tracking
- Seasonal adjustment columns
- Includes average sale value and inventory planning support
5. B2B Sales Forecast Template
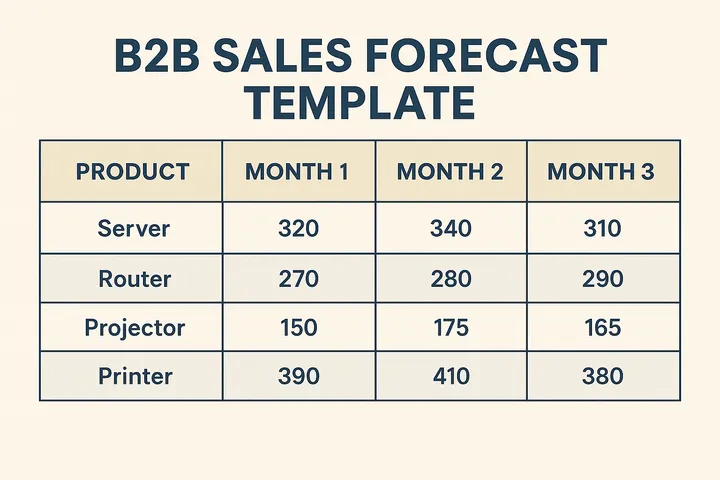
B2B sales often involve longer sales cycles and more complex deals. This template is designed to track opportunities within your pipeline and project revenue based on deal stage, value, and probability.
You can view forecasts by sales rep, product, or region, which helps you manage quotas and team performance more effectively.
Features:
- Forecasts revenue by opportunity stage
- Tracks reps, deal values, and close probabilities
- Designed for use with CRM data or manual inputs
6. Startup Sales Forecast Template
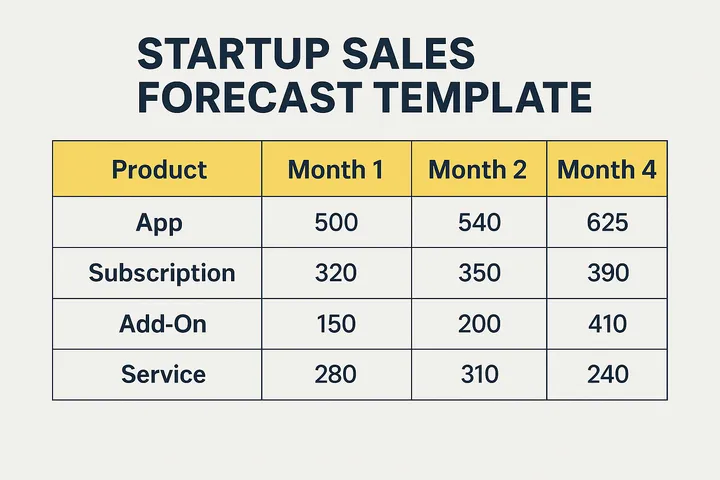
Startups often have limited historical data, so they need flexible forecasting tools. This template allows you to build a forecast using assumptions, target markets, and growth rates. You can model best- and worst-case scenarios and switch between different forecasting methods as your startup evolves.
Features:
- Flexible fields for experimenting with inputs
- Supports multiple forecast mode7ls (top-down, bottom-up)
- Includes space for funding and runway projections
7. Service-Based Sales Forecast Template

If you run a service-based business, this template helps you estimate revenue from client work. You can track income from hourly billing, fixed packages, or monthly retainers.
Features:
- Tracks billable hours, project fees, and client retainers
- Monthly and quarterly revenue tracking
- Designed for consultants, agencies, and freelancers
8. Product Launch Forecast Template
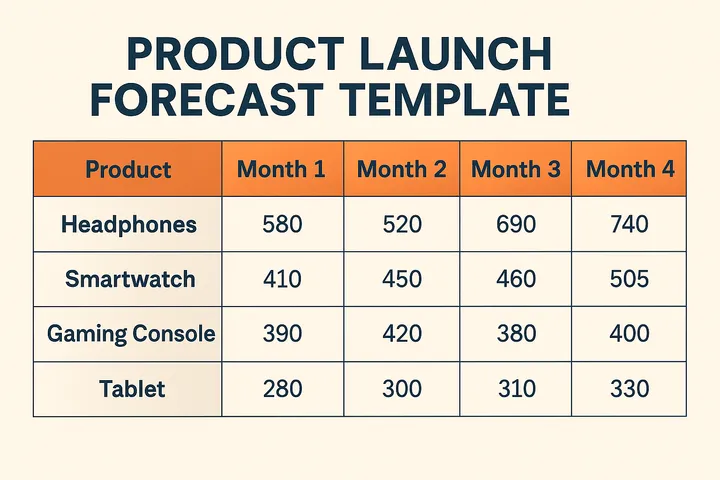
This template is ideal when you're about to release a new product and need to estimate revenue. It allows you to input expected units sold, price points, marketing impact, and timeline.
Features:
- Timeline-based sales forecast structure
- Sections for pricing, demand estimates, and promotions
- Helps calculate revenue by launch phase or marketing push
9. Annual Sales Forecast Template
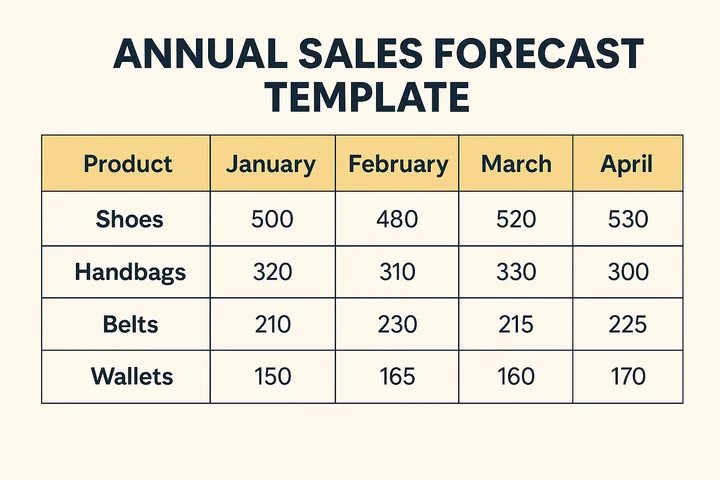
Planning for the full year? This template gives you a complete 12-month view of your forecast, broken down by team, product, or time period. It helps with goal setting, budgeting, and resource planning. Ideal for established companies or growing teams that need to align quarterly and annual targets.
Features:
- 12-month breakdown with monthly totals
- Goal vs actual tracking columns
- Supports department- or product-based forecasting
10. Free Sales Forecasting Template with Automation
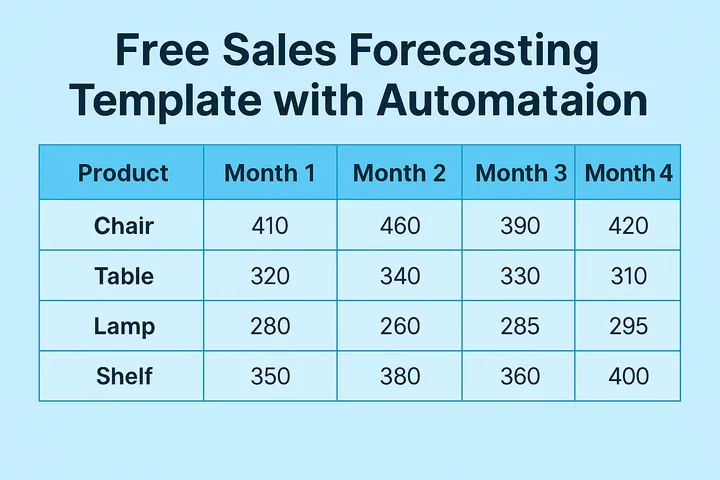
This template saves time by automatically calculating sales forecasts using pre-set formulas. It’s great if you want to skip the manual math and focus on insights. You just enter your inputs (like units sold, price, deal stage), and the sheet does the rest.
Features:
- Built-in logic for automatic calculations
- Dynamic charts and visual summaries
- Easily connects with CRM exports or Google Sheets
How to Use a Sales Forecast Template: Step-by-Step Instructions

Using a sales forecast template saves time and brings more accuracy to your planning. Follow these steps to set it up properly and make your forecast work for you.
1. Gather historical sales data
Start with your past numbers. Look at how much you sold in the last few months or years. This data helps you see patterns and trends.
You can use:
- Sales from previous months or years
- Data broken down by product, region, or sales rep
- Info from your CRM, spreadsheets, or invoices
2. Choose a forecasting method
Pick the method that fits your business and the data you have. Some methods are simple, others need more details.
Common options include:
- Historical forecasting (based on past sales)
- Pipeline forecasting (based on active deals)
- Opportunity stage forecasting (based on deal stages and close probabilities)
3. Input key data into the template
Now it's time to fill in your template. Add the data you’ve gathered into the right columns and rows.
You may include:
- Product or service name
- Units sold or expected
- Monthly sales or weekly targets
- Forecasted sales value
4. Calculate forecasted sales
Once your data is in, the template will help you calculate the results. Some templates do this automatically, while others need simple formulas.
Check for:
- Total sales expected for the month or quarter
- Revenue breakdown by product or team
- Percentage increase or decrease from past months
5. Review best, worst, and expected scenarios
A good forecast isn’t just one number. Try building three versions to prepare for different outcomes.
- Best case: everything goes better than expected
- Worst case: deals are delayed or lost
- Most likely case: based on current progress
6. Adjust based on seasonality or external factors
Your forecast should reflect real-world changes. Think about events that could affect sales, like holidays or market trends.
Adjust the forecast when:
- You expect lower demand during off-seasons
- A new product is launching
- External changes (like pricing or competition) might impact future sales
Tips & Best Practices for Maintaining an Accurate Sales Forecast
An accurate sales forecast helps your team plan better and avoid surprises. Here are some simple, practical ways to keep your forecast on track over time.
1. Regularly review and update your sales forecast
Sales data changes fast. That’s why your forecast should never be set once and forgotten.
- Update it weekly or monthly based on your sales cycle
- Adjust numbers if deals move in or out of the pipeline
- Review changes with your sales team during meetings
2. Involve your sales team to forecast sales more accurately
Your sales reps are closest to the deals. They often know what’s likely to close and what’s not.
- Ask reps for input on deal status and close dates
- Encourage honest updates, not just optimistic guesses
- Use their feedback to fine-tune the forecast
3. Use historical data carefully when you forecast sales
Past sales can show useful patterns, but they’re not always enough.
- Don’t rely too much on last year’s numbers
- Compare current sales trends with previous periods
- Look at changes in your sales process or market conditions
4. Factor in seasonality to forecast sales more reliably
Some months are always slower or busier than others. Ignoring this can lead to big errors.
- Look at how sales rise or drop each season
- Adjust your monthly forecasts to match those patterns
- Use past seasonal data to prepare for peaks and lows
5. Track accuracy every time you forecast sales
Don’t just create a forecast — go back and check how close it was.
- Compare forecasted sales vs actual results
- Look for patterns in where and why you missed
- Improve your forecasting method based on what you learn
6. Clean CRM data helps you forecast sales with confidence
Bad data leads to bad forecasts. If your CRM is full of old or wrong info, the forecast won’t help.
- Remove or close outdated deals
- Make sure contact info and deal stages are correct
- Set clear rules for how sales reps update the CRM
7 Smart Tools to Automate and Improve Sales Forecasting
Sales forecasting gets a lot easier when you have the right tools. These platforms help you track sales, update forecasts, and save time through automation.
Below is a mix of freemium and paid tools — all offering either a free plan, demo, or trial to get started.
Freemium Tools
1. Zoho CRM
Zoho CRM offers a free plan with sales forecasting features built in. It’s great for small teams looking to get organized and stay on top of their numbers.
Features:
- Sales pipeline tracking
- Custom dashboards and reports
- Forecast revenue by product, rep, or region
- Workflow automation
Best for: Small businesses and startups needing a free and flexible CRM.
2. Freshsales

Freshsales gives you everything from lead tracking to deal management — with forecasting built into the free version. It’s easy to set up and use.
Features:
- AI-powered deal insights
- Visual sales pipeline
- Forecast sales based on deal stages
- Basic email and contact management
Best for: Startups and small teams wanting an all-in-one CRM with forecasting.
3. HubSpot CRM

HubSpot CRM is free forever and packed with features to help you manage contacts, deals, and forecasts. It’s known for its clean interface and simple setup.
Features:
- Customizable sales dashboards
- Deal tracking and pipeline management
- Forecasting tools integrated with your pipeline
- Email templates and task automation
Best for: Sales teams that want a zero-cost solution with powerful tools and growth flexibility.
Paid Tools (Demo or Free Trial Only)
1. Alore.io – Free Demo on Request
Alore.io focuses on outbound sales automation with forecasting tools built into the process. It helps you plan, track, and optimize outreach from one platform.
Features:
- Email outreach and follow-up automation
- Campaign tracking and reporting
- Forecasted sales based on activity metrics
- Built-in CRM and lead scoring
Best for: Teams running cold outreach campaigns who want automation plus forecasting.
2. Salesforce Sales Cloud – 30-Day Free Trial
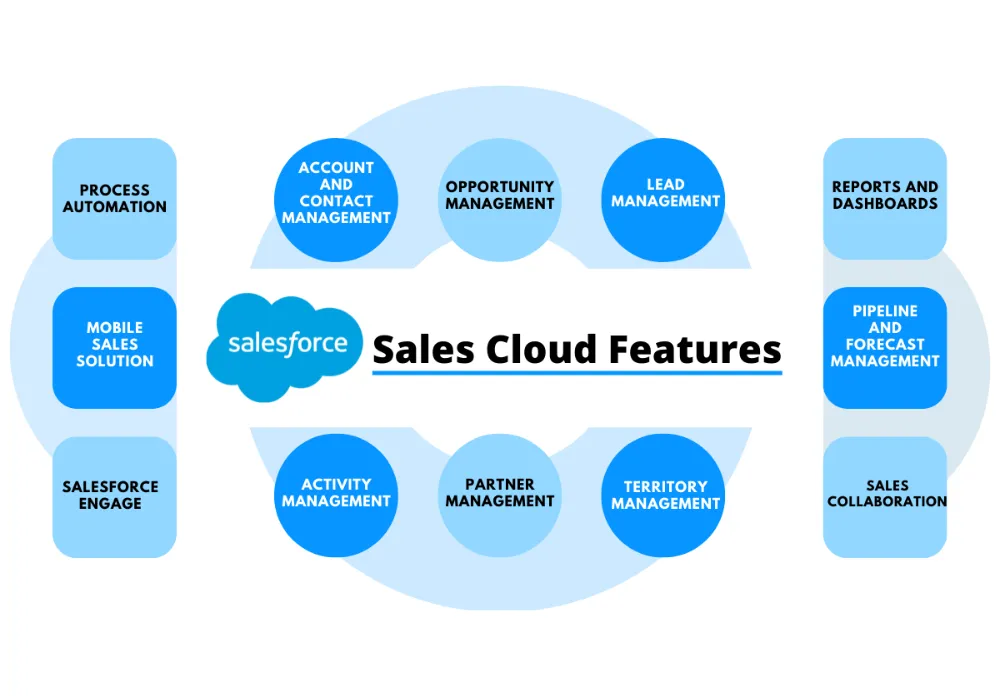
Salesforce is one of the most powerful CRMs in the world. Its forecasting tools are deep, customizable, and trusted by large sales teams.
Features:
- Real-time sales forecasting dashboards
- Custom forecast categories and pipelines
- AI-powered insights with Salesforce Einstein
- Full CRM and app integrations
Best for: Mid to large companies needing advanced forecasting and full-scale CRM features.
3. Pipedrive – 14-Day Free Trial
Pipedrive makes forecasting visual and easy to manage. It’s designed to help reps stay focused on the right deals.
Features:
- Forecast sales by pipeline and stage
- Deal rotting alerts and reminders
- Visual dashboards and drag-and-drop pipelines
- Sales goal tracking
Best for: SMBs that want a simple, visual way to track forecasts and improve deal flow.
4. Close CRM – 14-Day Free Trial
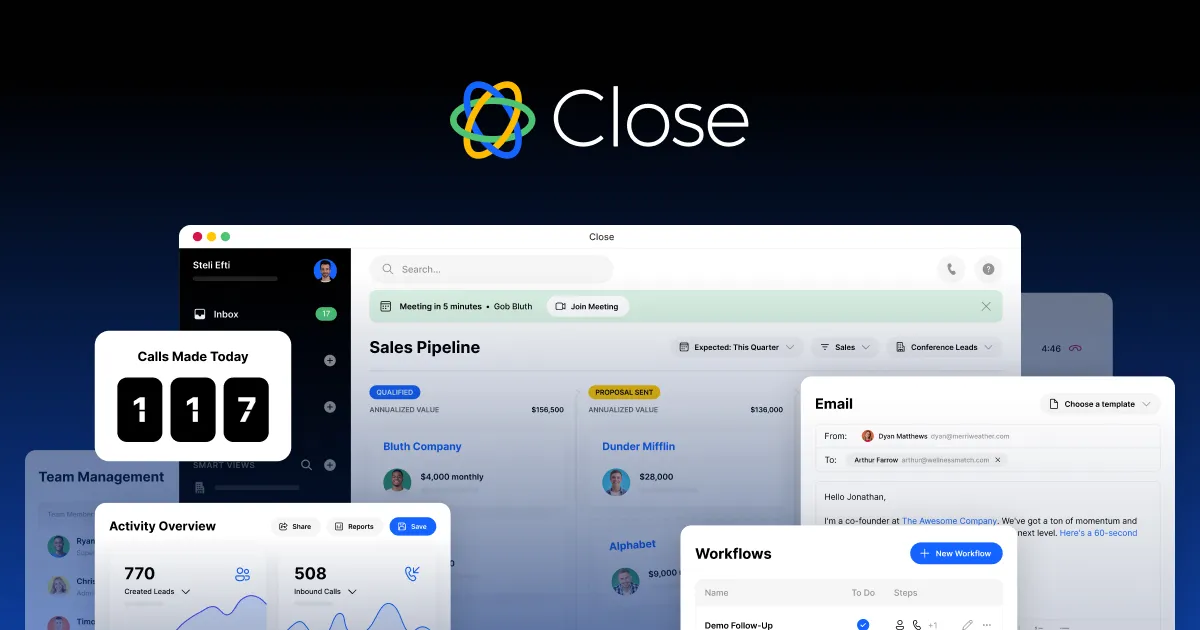
Close is built for inside sales teams who want speed and simplicity. Its forecasting tool is tied tightly to activity tracking.
Features:
- Forecast revenue based on pipeline activity
- Built-in calling, emailing, and SMS
- Smart filtering and reporting tools
- Automated follow-up reminders
Best for: Remote or inside sales teams that value speed and clear forecasting.
FAQ

1. What should I do if I don’t have any past sales data?
Start with estimates based on market research, competitor benchmarks, or your sales goals. Use assumptions and adjust frequently as real data comes in.
2. How often should I update my sales forecast template?
At least once a month. Weekly if your sales cycle is short or you’re in a fast-moving market.
3. Can I use the same template for different products or teams?
Yes, but customize fields like pricing, timelines, and conversion rates to match each product or team’s workflow.
4. What’s the difference between a sales forecast template and a sales report?
A forecast predicts future sales; a report shows past performance. Forecasting is forward-looking, reporting is backward-looking.
5. How do I validate if my forecast is actually accurate over time?
Compare forecasted sales vs. actual sales regularly. Track your forecast error rate (e.g., percentage difference) to refine future estimates.
Conclusion
Now that you've made it this far, you’re already ahead of most people who guess their way through sales planning. You took the time to understand what goes into forecasting, and that shows you're serious about building a system that works.
The real advantage isn’t just in using a template — it’s in being consistent, tracking what matters, and improving over time. So don’t let the momentum stop here. Block off 30 minutes, pick one template, and start filling it out with your own numbers. You don’t need to be perfect — you just need to start.


.webp)