

.svg)
.svg)
.svg)
When it comes to growing a successful SaaS business, understanding the right metrics is crucial. Tracking the right metrics isn’t just a nice-to-have—it’s essential for success.
By closely monitoring SaaS metrics like Customer Acquisition Cost (CAC), Monthly Recurring Revenue (MRR), and Customer Lifetime Value (CLTV), you gain valuable insights into your business’s health and growth potential.
Stick around to discover the 18 key metrics every SaaS business must track to thrive.
What are SaaS Metrics?
SaaS metrics are the key numbers that help you understand how well your SaaS business is doing. These metrics track everything from how much money you're making every month to how happy your customers are.
Here’s why SaaS metrics matter:
- Growth: By knowing your MRR and ARR, you can predict how much your business will grow in the next year.
- Profitability: Metrics like CAC and CLTV show you if your business is profitable or if you’re spending too much to get new customers.
- Customer Satisfaction: A low churn rate and high NRR often mean your customers are happy with your service.
Your business model must align with the SaaS metrics to ensure sustainable growth.
The Role of SaaS Metrics in Business Strategy
SaaS metrics play a huge role in shaping your business strategy. They tell you what’s working and what needs fixing.
Here's how SaaS metrics influence your business strategy:
1. Setting Goals
Metrics like Average Revenue Per User (ARPU) help you set realistic financial goals. For example, if you know your ARPU is $50, you can aim to increase it to $55 by offering premium features.
2. Making Decisions
SaaS companies use metrics like Net Revenue Retention (NRR) to decide where to focus their efforts. If your NRR is low, it might be time to focus on keeping existing customers happy instead of just getting new ones.
3. Measuring Success
By tracking your Gross Margin, you can see if your business is becoming more profitable over time. A higher gross margin means you’re making more money from each sale after costs.
Top SaaS Metrics To Monitor
1. Customer Acquisition Cost (CAC)
Customer Acquisition Cost (CAC) is the amount of money you spend to get a new customer. This includes everything from marketing expenses to sales team salaries.
Why is it important:
Understanding CAC helps you know if your business is spending too much or too little on acquiring new customers. By tracking CAC, you can make better decisions on where to spend your marketing dollars.
How to track it:
- Add up all marketing and sales costs: This includes online ads, salaries, and any other costs associated with getting new customers.
- Divide the total marketing expenses by the number of new customers: For instance, if you spent $10,000 on marketing and acquired 100 new customers, your CAC would be $100 per customer.
Keeping CAC low is essential for the success of your SaaS company. Lowering CAC while maintaining customer satisfaction is a recipe for long-term success.
2. Customer Lifetime Value (CLTV)
Customer Lifetime Value (CLTV) is the total revenue you expect to earn from a customer over the time they stay with your business. This metric helps you understand how valuable each customer is to your business.
Why is it important:
Knowing CLTV helps you see if your business is profitable in the long run. If your CLTV is higher than your CAC, your business is in good shape.
For example, if it costs you $100 to acquire a customer, but they bring in $500 over their lifetime, that’s a strong return on investment.
How to track it:
- Calculate the average revenue per user (ARPU): This is how much money a customer spends with you each month.
- Multiply by the customer lifespan: If a customer stays with you for 10 months and spends $50 per month, their CLTV is $500.
To maximize CLTV, focus on customer satisfaction and retention. The longer customers stay with you, the higher their lifetime value.
3. Monthly Recurring Revenue (MRR)
Monthly Recurring Revenue (MRR) is the total predictable revenue your business generates every month. This is important because it shows how much money you can expect to bring in regularly from your existing customers.
Why is it important:
MRR helps you see how well your SaaS business is growing. For example, if your MRR is increasing month by month, it means your business is on the right track.
But if it’s decreasing, you might need to take action to keep your existing customers happy or attract new customers. This metric also helps in forecasting and budgeting, ensuring that you can plan for the future. According to Younium, a B2B SaaS subscription business can get accurate data by automating the subscription billing process.
How to track it:
- Add up all subscription payments: Calculate the total amount of money your customers are paying each month.
- Exclude one-time payments: Only include the recurring payments, as these show the predictable revenue.
By tracking MRR, you can get a clear picture of your business’s financial health on a month-to-month basis. This helps you make informed decisions about where to invest your resources.
4. Annual Recurring Revenue (ARR)

Annual Recurring Revenue (ARR) is the total predictable revenue your SaaS business generates over a year. It’s similar to MRR but gives a longer-term view of your business’s financial health.
Why is it important:
ARR provides a clearer picture of your business’s long-term growth. It’s especially useful for SaaS companies that offer yearly subscriptions.
For example, if your ARR is growing, it means more customers are committing to your service for the long haul. This metric is also crucial when seeking investment or planning for large-scale business decisions.
How to track it:
- Multiply your MRR by 12: This gives you a simple calculation of your annual recurring revenue.
- Include annual contracts: If you have customers on yearly plans, add their payments to your ARR calculation.
ARR helps you see how stable and reliable your revenue is over time. By tracking both MRR and ARR, you can get a well-rounded view of your business’s financial health and make strategic decisions accordingly.
5. Customer Churn Rate

Customer churn, also known as the turnover rate, represents the percentage of customers who discontinue using your service within a certain time frame. It shows how many customers you lose over time. For example, if you start with 100 customers and lose 5 in a month, your churn rate is 5%.
Why is it important:
A high churn rate can hurt your SaaS business. Losing customers means losing recurring revenue. If your churn rate is too high, it might indicate problems with your product or customer satisfaction.
Reducing churn is crucial to maintaining a stable customer base and ensuring your recurring revenue doesn’t decline.
How to track it:
- Calculate the percentage of customers lost: Divide the number of customers you lost during a period by the number of customers you had at the beginning of that period, then multiply by 100.
- Monitor monthly: Regular tracking helps you spot trends and address issues quickly.
Lowering churn should be a priority for any SaaS company. Focus on customer success, improving product quality, and offering excellent support to reduce churn.
6. Net Revenue Retention (NRR)
Net Revenue Retention (NRR) measures the revenue you keep from existing customers, including upgrades, downgrades, and churn. If your NRR is over 100%, it means your revenue from current customers is growing even after accounting for any losses.
Why is it important:
A high NRR indicates that your SaaS business is doing well with existing customers. It shows that you’re not just retaining customers but also increasing revenue through upsells or expanding services.
For example, if a customer upgrades to a higher plan, it increases your NRR. This metric is crucial because it reflects the health and growth potential of your customer relationships.
How to track it:
- Calculate the revenue from existing customers: Include upgrades, downgrades, and lost revenue from churned customers.
- Divide by the starting revenue from those customers: Then multiply by 100 to get your NRR percentage.
A strong NRR indicates that your business is retaining and expanding its customer base effectively. To improve NRR, focus on delivering value to existing customers and offering additional features or services they need.
7. Gross Margin

Gross Margin is the percentage of revenue left after subtracting the cost of goods sold (COGS). In simpler terms, it’s the money left over after paying for the basics to deliver your service. For example, if you make $100 from a customer but spend $40 on costs, your gross margin is 60%.
Why is it important:
A high gross margin means your business is more profitable. It shows that you’re keeping more of what you earn, which can be used to grow your SaaS company.
If your gross margin is low, it might indicate that your costs are too high, and you need to find ways to reduce them.
How to track it:
- Calculate revenue: Add up all the money you make from customers.
- Subtract COGS: Include costs like software hosting, customer support, and other expenses directly related to delivering your service.
- Divide by total revenue and multiply by 100: This gives you the gross margin percentage.
A healthy gross margin ensures your SaaS business can sustain itself and invest in future growth.
8. Average Revenue Per User (ARPU)

Average Revenue Per User (ARPU) is the average amount of money each customer brings in during a specific period. For instance, if you have 100 customers and earn $10,000 in a month, your ARPU is $100.
Why is it important:
ARPU helps you understand the value of each customer. A higher ARPU indicates that your customers are spending more, which is good for business.
If your ARPU is low, you might need to look at upselling or offering more premium features.
How to track it:
- Calculate total revenue: Add up all the money earned from your customers in a given period.
- Divide by the number of customers: This gives you the ARPU for that period.
Tracking ARPU can help you adjust your pricing strategy or focus on higher-value customers.
9. Customer Engagement Score

Customer Engagement Score measures how actively your customers are using your product. It shows how often customers log in, use features, or interact with your SaaS business. For example, if customers are daily active users logging in and using multiple features, their engagement score will be high.
Why is it important:
A high Customer Engagement Score means that your customers find your product valuable and are likely to stick around.
Low engagement can be a warning sign that customers might churn, or stop using your service. By tracking engagement, you can identify which customers might need extra attention to keep them from leaving.
How to track it:
- Monitor login frequency: Track how often users log in to your product.
- Measure feature usage: See how many features customers are using and how often.
- Analyze time spent: Look at how much time customers spend on your platform.
By keeping an eye on this metric, you can take action to increase engagement and reduce churn.
10. Time to Value (TTV)
Time to Value (TTV) is the time it takes for a customer to start seeing the value in your product after signing up. In simple terms, it's how quickly a customer gets what they expected from your service. For example, if a customer can start benefiting from your product in just a few days, your TTV is short.
Why is it important:
A shorter TTV means that customers are getting value from your product quickly, which makes them more likely to stay with your SaaS company.
If TTV is long, customers might get frustrated and leave before they experience the benefits of your product. Reducing TTV helps improve customer satisfaction and retention.
How to track it:
- Measure the onboarding process: Track how long it takes for new customers to complete the onboarding steps.
- Analyze user feedback: Look at when customers start mentioning the benefits of your product in reviews or surveys.
- Monitor product usage milestones: Identify when customers reach key milestones, such as completing a setup or achieving their first goal with your product.
Focusing on reducing TTV can make a big difference in customer satisfaction and long-term success.
11. Lead-to-Customer Conversion Rate

Lead-to-Customer Conversion Rate measures how many leads, or potential customers, turn into actual paying customers. If you get 100 leads and 20 of them become customers, your conversion lead to customer rate is 20%.
Why is it important:
This metric shows how well your marketing and sales efforts are working. A high conversion rate means you’re effectively turning interest into sales.
A low conversion rate might mean you need to improve your sales process or better qualify your leads.
How to track it:
- Count the number of leads: Track how many potential customers you attract through your marketing efforts.
- Count the number of conversions: Monitor how many of those leads actually become paying customers.
- Divide and multiply: Divide the number of conversions by the number of leads, then multiply by 100 to get the percentage.
Improving this rate can lead to more revenue without needing to increase your marketing budget.
12. Expansion Revenue

Expansion Revenue is the extra money you earn from your existing customers. This can come from sales strategies, upselling (getting customers to buy more expensive services) or cross-selling (getting customers to buy additional services).
Why is it important:
This metric shows how well you are maximizing the value of your existing customers. Growing your revenue from current customers is often cheaper and easier than acquiring new ones.
If your Expansion Revenue is strong, it means your customers find enough value in your service to spend more.
How to track it:
- Monitor upsells: Track how many customers upgrade to higher plans or purchase additional features.
- Track cross-sells: See how many customers buy additional services that complement what they already use.
- Calculate the revenue: Add up the extra money you make from these sales over a specific period.
Increasing Expansion Revenue is a great way to improve your overall recurring revenue without constantly needing new customers.
13. Months to Recover CAC

Months to Recover CAC tells you how long it takes to earn back the money you spent to acquire a customer. If it takes too long to recover your customer acquisition costs, your business might struggle to be profitable.
Why is it important:
This metric is crucial because it shows if your customer acquisition strategy is sustainable. If it takes too many months to recover CAC, you may need to rethink your strategy.
For example, if you spend $1,000 to get a customer and it takes 10 months to earn that money back, that’s 10 months of waiting before you start making a profit.
How to track it:
- Calculate your CAC: This includes all the costs related to getting a new customer, like marketing and sales expenses.
- Determine monthly revenue per customer: Find out how much each customer is paying you per month.
- Divide CAC by monthly revenue: This will give you the number of months it takes to recover your costs.
Tracking this metric ensures you’re not waiting too long to see returns on your investments.
14. Sales Cycle Length
Sales Cycle Length is the time it takes to turn a lead into a paying customer.
If your sales cycle is too long, it could slow down your company’s growth. For example, if it takes 6 months to close a sale, that’s a long wait to get keep customers acquired.
Why is it important:
Understanding your sales cycle helps you find ways to close deals faster. A shorter sales cycle means you can bring in more customers in less time, which is good for your bottom line.
If your sales cycle is long, it might mean your process is too complicated, or your leads need more nurturing.
How to track it:
- Record the date a lead enters your pipeline: This is the start of your sales cycle.
- Record the date the deal is closed: This is the end of your sales cycle.
- Calculate the time between the two dates: This gives you the length of your sales cycle.
Monitoring this metric helps you identify bottlenecks in your sales process and make improvements to speed things up.
15. Referral Rate
Referral Rate measures the percentage of new customers that come from existing customers' recommendations.
If your current customers love your service, they’ll likely tell others about it. For example, if you gain 100 new customers and 20 of them came from referrals, your referral rate is 20%.
Why is it important:
Referral Rate is important because it shows how satisfied your customers are. When your customers refer others to your software as a service, it’s a sign that they trust your product. Plus, referrals often bring in high-quality leads at a lower cost than traditional marketing efforts.
How to track it:
- Monitor new customer sources: Track how many new customers mention that they were referred by existing customers.
- Calculate the percentage: Divide the number of referred customers by your total new customers, then multiply by 100 to get your Referral Rate percentage.
A high Referral Rate can enhance your customer base and reduce your marketing costs, making it an essential metric to monitor.
16. Burn Rate
Burn Rate is the amount of money your company is spending each month. It shows how quickly you are using up your cash flow and reserves. For instance, if your business is spending $50,000 a month, that’s your Burn Rate.
Why is it important:
Burn Rate is critical because it helps you understand how long your business can survive without additional funding. If your Burn Rate is too high, you might run out of cash before reaching profitability. By keeping an eye on this metric, you can make better decisions about spending and fundraising.
How to track it:
- Calculate monthly expenses: Add up all the money your company spends in a month, including salaries, rent, and other costs.
- Compare against revenue: Track how much money you are making versus how much you are spending to get a clear picture of your Burn Rate.
Monitoring your Burn Rate helps you manage your finances and ensures that your business remains sustainable.
17. Customer Satisfaction Score (CSS)

Customer Satisfaction Score (CSS) gauges how satisfied your customers are with your product or service. It’s usually gathered through surveys where customers rate their satisfaction on a scale, like 1 to 5 or 1 to 10.
Why is it important:
CSS is important because it provides direct feedback from your customers. High scores mean your customers are happy, while low scores signal that improvements are needed.
Keeping your customers satisfied is crucial for retention and growth. For example, if your CSS is consistently high, it means your SaaS business is meeting customer expectations.
How to track it:
- Conduct regular surveys: Ask customers to rate their satisfaction after using your service or interacting with your support team.
- Analyze the scores: Calculate the average score to get an overall view of customer satisfaction.
- Look for trends: Identify patterns in the feedback to understand what’s working and what needs improvement.
By tracking CSS, you can make informed decisions to enhance your product and keep your customers happy.
18. Net Promoter Score (NPS)
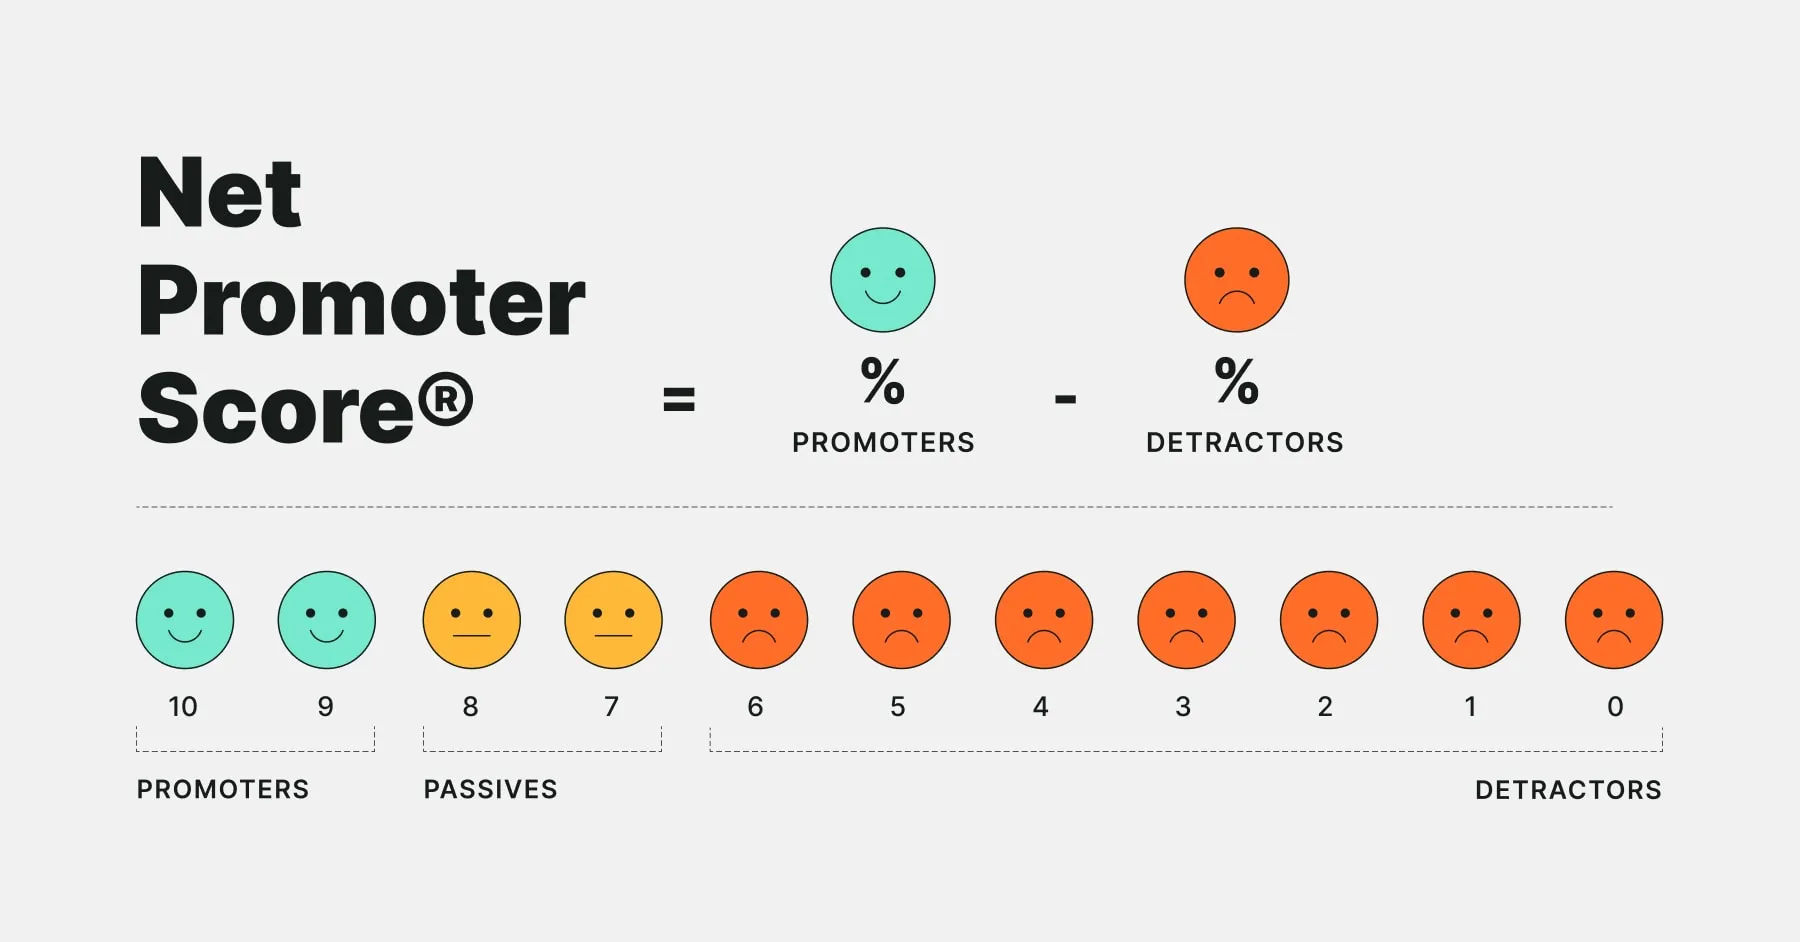
Net Promoter Score (NPS) measures how likely your customers are to recommend your product to others.
It’s calculated by asking customers a simple question: “On a scale of 0 to 10, how likely are you to recommend our product to a friend or colleague?” Based on their responses, customers are categorized as Promoters, Passives, or Detractors.
Why is it important:
NPS is important because it helps you understand customer loyalty. A high NPS indicates that your customers are satisfied and willing to promote your product, which can lead to more referrals and growth.
On the other hand, a low NPS can be a warning sign that your customers are unhappy and might leave. For example, if your NPS is high, it means you’re doing a good job of keeping your customers happy and loyal.
How to track it:
- Survey your customers: Ask them how likely they are to recommend your product, and record their responses.
- Calculate the NPS: Determine the NPS by subtracting the percentage of Detractors (customers who rate 0-6) from the percentage of Promoters (customers who rate 9-10).
- Monitor changes over time: Keep an eye on how your NPS changes after product updates or major events.
NPS is a powerful metric that provides insight into customer satisfaction and loyalty, helping you focus on areas that need improvement.
10 Important Software's to Use

1. ChartMogul for Revenue Analytics
ChartMogul is a tool that helps you track your revenue metrics. You can easily see your Monthly Recurring Revenue (MRR), Annual Recurring Revenue (ARR), and Customer Lifetime Value (CLTV).
Why is it important:
Revenue is the lifeblood of your SaaS company. Without keeping a close eye on it, you might miss out on important trends. For example, if your MRR is growing steadily, that’s a good sign. But if it’s dropping, you need to find out why quickly.
How to use it:
- Connect your billing system: ChartMogul integrates with popular billing systems like Stripe.
- Monitor your metrics: Set up dashboards to track MRR, ARR, and more.
- Analyze trends: Use the data to understand customer churn, revenue growth, and net revenue retention.
2. Baremetrics for Customer Insights
Baremetrics is another powerful tool for SaaS businesses. It helps you track important metrics related to your customers, such as churn rate and Customer Acquisition Cost (CAC).
Why is it important:
Understanding your customers is key to keeping them. Baremetrics lets you see how your customer base is changing over time. For example, if customer churn is high, you might need to improve your product or customer support.
How to use it:
- Customer segmentation: Break down your customers into different groups (e.g., by how much they spend).
- Monitor churn: Keep an eye on how many customers are leaving and why.
- Track Customer Lifetime Value (CLTV): Understand how much revenue you can expect from each customer over time.
3. ProfitWell for Subscription Management
ProfitWell is a software that focuses on managing your subscriptions. It provides accurate metrics for your Monthly Recurring Revenue (MRR), Customer Lifetime Value (CLTV), and Customer Acquisition Cost (CAC).
Why is it important:
For a SaaS business, managing subscriptions effectively is crucial. ProfitWell helps you track recurring revenue and reduce customer churn. If your customer churn rate is high, ProfitWell will highlight this so you can take action.
How to use it:
- Integrate with your billing system: ProfitWell works seamlessly with popular billing systems like Stripe.
- Monitor key metrics: Track your MRR, ARR (Annual Recurring Revenue), and CLTV in real-time.
- Identify opportunities: ProfitWell highlights trends in your data, showing you where to focus your efforts to retain paying customers and improve net revenue retention.
4. Mixpanel for User Engagement
Mixpanel is a tool designed to track user behavior. It helps you understand how your users are interacting with your product, which features they use the most, and where they might drop off.
Why is it important:
Engaged users are more likely to become long-term customers. By using Mixpanel, you can increase your customer engagement score and ensure that your users are satisfied with your product. If users stop engaging, you can take action to re-engage them and reduce churn.
How to use it:
- Track user activity: Mixpanel allows you to monitor what actions users take within your app.
- Analyze funnels: See where users drop off during key processes like sign-up or purchase.
- Improve features: Use the data to make informed decisions on which features to improve or promote to boost customer satisfaction and retention.
5. Customer.io for Automated Customer Communication
Customer.io is a tool that automates customer communication. It helps you send targeted messages to your users based on their behavior. This tool is excellent for increasing customer engagement and satisfaction.
Why is it important:
In a SaaS business, keeping customers engaged is crucial. With Customer.io, you can set up automated emails that reach your customers at the right time. For example, if a customer hasn't used your service in a while, you can send them a reminder. This improves customer retention and reduces churn.
How to use it:
- Segment your customers: Group your customers based on their behavior (e.g., active users, churned customers).
- Create automated workflows: Set up email sequences that trigger based on customer actions, such as signing up or not using the product for a week.
- Measure results: Track open rates, click rates, and engagement scores to see how well your messages are performing.
6. Heap for Product Analytics
Heap is a tool that automatically tracks user interactions within your product. It helps you see what features your customers are using and where they might be getting stuck.
Why is it important:
Understanding customer behavior is key to improving your product. Heap gives you insights into what’s working and what’s not. If customers are frequently abandoning a feature, it might need improvement.
This tool helps you enhance the user experience, leading to higher customer satisfaction and lifetime value.
How to use it:
- Track all user actions: Heap automatically records every click, page view, and interaction without needing manual setup.
- Analyze user flows: See how users navigate through your product and where they drop off.
- Improve features: Use the data to identify which features need improvement or which ones are most popular.
7. Zendesk for Customer Support Metrics
Zendesk is a customer support tool that tracks metrics related to support tickets, response times, and customer satisfaction.
Why is it important:
Customer support is crucial in SaaS companies. Happy customers stay longer and provide recurring revenue. Zendesk helps you monitor how well your support team is performing. If your support team responds quickly and resolves issues effectively, it leads to better customer retention and satisfaction.
How to use it:
- Monitor support tickets: Track how many tickets are opened and resolved daily.
- Measure response time: Ensure that customers are getting timely responses.
- Track customer satisfaction: Use customer satisfaction scores to see how happy your customers are with your support.
8. HubSpot for CRM and Sales Metrics
HubSpot is a CRM (Customer Relationship Management) tool that tracks sales metrics like customer acquisition cost (CAC), conversion rates, and total revenue generated.
Why is it important:
Sales metrics are key to growing your SaaS business. HubSpot helps you manage your sales process, track new customers, and monitor your sales pipeline. By keeping track of customer acquisition and sales, you can ensure that your business is on the right path.
How to use it:
- Track sales activities: Monitor how many leads your sales team is working on and their conversion rates.
- Measure Customer Acquisition Cost (CAC): See how much it costs to acquire new customers.
- Monitor revenue: Keep an eye on the revenue generated from new and existing customers.
9. Looker for Data Visualization
Looker is a tool that helps you visualize your SaaS metrics. It turns complex data into easy-to-understand charts and graphs.
Why is it important:
Visualizing data makes it easier to see trends and patterns. With Looker, you can quickly spot changes in your monthly recurring revenue, customer churn, or your average customer and acquisition cost. This helps you make faster, smarter decisions to grow your SaaS business.
How to use it:
- Create dashboards: Set up dashboards that show your key metrics, like recurring revenue and customer lifetime value.
- Share insights: Use Looker's sharing features to present data to your team or stakeholders.
- Monitor trends: Keep an eye on important trends in your data, such as customer churn rates or net revenue retention.
10. Kissmetrics for Tracking Existing Customers' Behavior
Kissmetrics is a tool that tracks how your existing customers interact with your product. It gives you insights into their behavior, helping you improve customer engagement and retention.
Why is it important:
Understanding your existing customers is crucial for reducing churn and increasing lifetime value. With Kissmetrics, you can see which features your customers use most and which ones they ignore. This helps you tailor your product to meet their needs better.
How to use it:
- Track user behavior: Monitor how your customers use your product, from sign-ups to feature usage.
- Segment your customers: Group customers based on their behavior, such as active users versus churned customers.
- Improve engagement: Use the data to create strategies that keep your customers engaged and satisfied.
Conclusion
Tracking SaaS metrics is vital for the success of your business. These metrics give you a clear picture of your company’s health and guide your decisions.
By monitoring important metrics like customer acquisition cost, revenue churn amount, recurring revenue, and customer satisfaction, you can ensure your SaaS business continues to grow.
Remember, using tools like Looker and others can help you visualize data and understand customer behavior better. This makes it easier to keep your existing customers happy and attract new ones. Stay focused on these key metrics, and you'll be on the path to long-term success.


.webp)
