
.svg)
.svg)
.svg)
Sales statistics are crucial for optimizing sales strategies and improving performance across various aspects of the sales process. Understanding key metrics, like sales reps' performance, sales teams' effectiveness, and the impact of sales training, can lead to more informed decision-making. By analyzing sales stats, businesses can pinpoint which strategies yield the best return on investment, assess the productivity of sales professionals, and refine their sales processes.
Effective use of sales statistics helps in identifying trends, forecasting future sales, and setting realistic sales quotas. It also guides the development of sales strategies that can lead to better alignment between sales and marketing teams, ensuring that efforts are not duplicated and resources are optimally used.
For sales managers, statistics provide insights into areas needing improvement, whether it's in cold calling techniques or follow-up stats. Sales call statistics, for instance, can reveal the success rate of calls and help refine approaches to increase closure rates.
Furthermore, sales statistics play a significant role in training new sales reps and enhancing the skills of existing ones. They allow sales leaders to establish a high performing sales environment, driven by data-informed strategies that directly address the dynamics of their specific market. Thus, harnessing the power of sales statistics is essential for any business looking to thrive in a competitive marketplace.
Key Sales Statistics to Master the Art of Selling in 2024
1. Inside Sales Statistics

Conversion Rates:
- Average Conversion Rate: The average conversion rate for inside sales is expected to hover around 20% in 2024, reflecting a growing proficiency in digital sales techniques.
- Conversion by Industry: Conversion rates can vary significantly by industry, with tech and healthcare seeing higher rates due to increased demand for digital and remote solutions.
Call Effectiveness:
- Optimal Call Times: Data indicates the best times to make sales calls are between 10 am and 11 am and then again between 4 pm and 5 pm, capturing prospects during their peak decision-making times.
- Average Call Duration: Successful inside sales calls often last between 7 to 10 minutes, striking a balance between being informative and respecting the prospect’s time.
Lead Response Time:
- Impact on Conversions: Responding to leads within 5 minutes can increase the likelihood of conversion by up to 400%. Delay beyond 30 minutes drastically reduces the likelihood of converting the lead.
Sales Follow-Up:
- Number of Contacts: It takes an average of 5 follow-ups after the initial contact for most sales to be closed, underscoring the need for persistent, structured follow-up strategies.
- Follow-Up Timing: Immediate follow-ups within the first hour of contact show a 7x effectiveness in response rate compared to those done 24 hours later.
Email Effectiveness:
- Open Rates: The average open rate for sales emails is around 18%, with personalized subject lines seeing an increase of up to 50% in open rates.
- Click-Through Rates: Personalized emails achieve a 14% click-through rate and a 10% conversion boost.
Technology Adoption:
- CRM Usage: 91% of companies with more than 11 employees now use CRM systems to enhance their sales processes, indicating a critical integration of technology in managing sales operations.
- Automation Tools: Sales teams using automation software have seen a 14% increase in productivity and a 12% reduction in overall sales costs.
Sales Training and Development:
- Ongoing Training: Continuous training for inside sales teams can increase sales by up to 50% per sales rep.
- Investment in Training: Companies that invest regularly in sales training achieve 24% higher profit margins compared to those that spend less.
2. Outside Sales Statistics

Sales Cycle Length:
- Comparison with Inside Sales: Outside sales cycles are typically 30-40% longer than inside sales due to the more complex nature of deals and the need for face-to-face interactions.
- Average Duration: On average, outside sales cycles range from 45 to 90 days, depending on the industry and complexity of the product or service.
Deal Size:
- Larger Deal Values: The average deal size for outside sales is generally larger, with transactions often exceeding twice the value of those in inside sales.
- Impact on Strategy: Larger deals require more personalized relationship management and longer-term nurturing strategies.
Travel and Expenses:
- Budget Allocation: Companies allocate approximately 12% of their total sales budget to cover travel and expenses for outside sales, reflecting the costs of in-person engagements.
- ROI on Travel: Effective management of travel expenses can lead to a return on investment of up to 20% due to enhanced relationship building and deal closure rates.
Client Meetings and Interactions:
- Meeting Effectiveness: Face-to-face meetings have a closing rate of approximately 40%, significantly higher than remote interactions.
- Average Meetings Per Sale: It often takes 3 to 5 in-person meetings to close a deal in outside sales, emphasizing the importance of each interaction.
Territory Management:
- Sales Coverage: Optimal territory alignment can increase sales by up to 15%. Proper management ensures that sales reps are not overlapping and are covering the right geographic or vertical markets.
- Technology Use: Leveraging geographic data and CRM insights for territory management can boost sales efficiency by reducing travel time and ensuring more targeted customer interactions.
Technology and Tools:
- Mobile Technology Adoption: Over 70% of outside sales reps use mobile technology to access CRM data and sales materials on-the-go, improving responsiveness and preparation for client interactions.
- Digital Presentation Tools: Utilization of digital tools during presentations is linked to a 20% increase in conversion rates, as they allow for more dynamic and engaging sales pitches.
Training and Skill Development:
- Skill Enhancement: Continuous training in negotiation and relationship management skills can increase deal closure rates by up to 25% for outside sales teams.
- Investment in Development: Companies that invest in regular, advanced training for their outside sales teams see a 30% higher performance in revenue growth.
3. Sales Prospecting Statistics

Prospecting Efficiency:
- Lead Response Time: Companies that contact potential leads within an hour of receiving an inquiry are nearly 7 times more likely to have meaningful conversations with key decision-makers than those that wait longer.
- Best Days for Prospecting: Wednesday and Thursday are the best days to prospect, showing the highest rates of positive engagement compared to other weekdays.
Prospecting Tools and Techniques:
- Email vs. Phone Prospecting: Emails have a response rate of around 18%, while cold calling has a significantly lower response rate of about 1-3%. However, integrating both methods strategically can enhance overall response rates.
- Social Selling: Sales reps who incorporate social media into their prospecting strategy see a 45% increase in sales opportunities compared to those who don’t use social media.
Prospecting Conversion Rates:
- Conversion Success: On average, it takes 8 to 12 touches to convert a lead from an initial contact into a sales-ready prospect.
- Quality vs. Quantity: High-quality leads that are well-targeted yield a 70% better conversion rate than generic cold contacts.
Impact of CRM on Prospecting:
- CRM Utilization: Sales teams that effectively use CRM systems can improve their conversion rates by up to 30%, due to better data organization and follow-up tracking.
- Data-Driven Prospecting: 40% of salespeople say that having more accurate data leads to more efficient prospecting sessions.
Prospecting Challenges:
- Common Hurdles: 42% of sales reps feel that prospecting is the most challenging part of the sales process, citing lack of quality data and lead fatigue as major barriers.
- Overcoming Obstacles: Companies that invest in ongoing training and up-to-date prospecting tools report a 25% higher success rate in overcoming these challenges.
Prospecting Training and Skills:
- Skill Development: Continuous training in advanced prospecting techniques, such as account-based marketing (ABM) and personalized outreach, results in a 50% higher effectiveness in lead conversion.
- Investment in Training: Businesses that dedicate resources to regular prospecting training see a 37% increase in sales success compared to those that do not prioritize training.
4. Sales Call Statistics

Call Response and Success Rates:
- Optimal Call Timing: Studies show that the best times to make sales calls are between 4 pm and 5 pm, closely followed by between 11 am and 12 pm. These times capture decision-makers more often available and receptive.
- Success Rate by Call Timing: Calls made on Thursdays show the highest success rate at 19.1%, followed closely by calls on Wednesday, suggesting mid-week is the most effective time for sales calls.
Average Call Duration:
- Ideal Call Length: The optimal sales call duration is around 10 minutes. Calls that last between 6 and 10 minutes have a significantly higher probability of success compared to shorter or much longer calls.
- Engagement: Calls that engage the prospect within the first minute by discussing their needs and how your offering can meet them are 40% more likely to convert.
Follow-Up Calls:
- Follow-Up Frequency: It typically takes an average of five follow-up calls after the initial meeting to secure a sale. However, nearly 44% of sales reps give up after just one follow-up.
- Effectiveness of Persistence: Persisting with follow-ups can increase the chance of a sale by up to 70%, emphasizing the importance of resilience in sales strategies.
Conversion Metrics:
- Call to Meeting Ratios: On average, it takes 8 cold call attempts to reach a prospect, but only 2-3 meaningful conversations are required to schedule a meeting.
- Meeting to Close Ratios: From initial contact, approximately 20% of meetings lead to an eventual sale, showcasing the importance of quality interactions over quantity.
Sales Call Preparation:
- Pre-Call Research: Sales reps who spend at least 15 minutes doing pre-call research are 35% more likely to have a successful sales call than those who do not prepare adequately.
- Customization Impact: Tailoring the call based on the prospect’s background, needs, and previous interactions increases the chances of success by 75%.
Technology and Tools:
- CRM Utilization: Utilizing CRM to record insights and follow-up tasks increases call efficiency by 25% and conversion rates by 18%.
- Automation Tools: Sales teams that employ automated dialing and call scheduling tools report a 30% time savings per day and a 22% increase in call volume with positive outcomes.
Training and Performance Monitoring:
- Impact of Ongoing Training: Continuous training in call strategies and techniques can enhance sales rep performance by up to 50%.
- Role of Analytics: Using advanced analytics to monitor call quality and outcome trends helps refine approaches and strategies, boosting success rates by an average of 20%.
5. Social Selling Statistics

Adoption and Usage:
- Rise of Social Selling: With a steep increase in B2B buyer activity online, over 75% of sales professionals globally are now using social selling tools. The use of platforms like LinkedIn, Twitter, and Instagram for engaging potential clients has become integral.
- Impact on Sales Success: Sales reps who embrace social selling outperform their peers, with a 51% higher likelihood of meeting sales quotas.
Efficiency and Engagement:
- High Performing Sales Teams: Teams that effectively use social selling practices report a 25% increase in achieving their sales targets.
- Sales Calls Integration: Incorporating social media insights into pre-call planning can enhance the relevance and personalization of sales calls, increasing conversion rates by up to 35%.
Lead Generation and Conversion:
- Social Media Leads: Conversion rates for leads generated through social selling are 7 times higher than those from traditional cold calling methods.
- Engagement Levels: Posts and interactions that include valuable content for potential clients achieve 65% higher engagement rates, leading to more direct inquiries and sales opportunities.
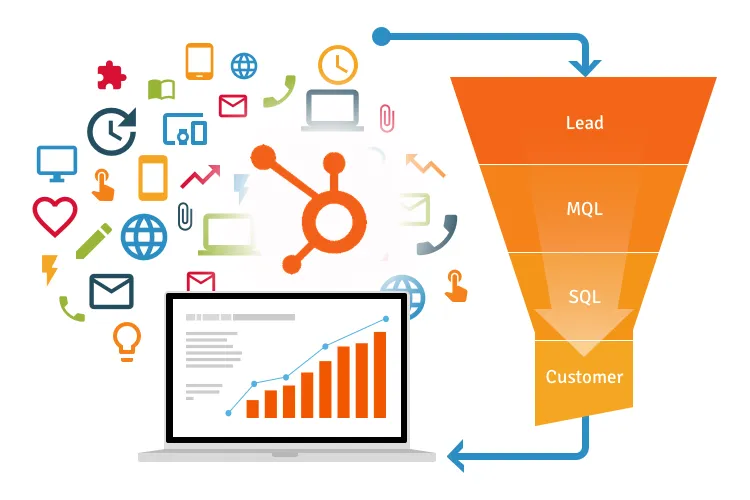
Sales Process and Customer Journey:
- Sales and Marketing Teams Alignment: Coordination between sales and marketing teams in crafting social selling strategies leads to a 67% improvement in progressing leads through the sales funnel.
- Customer Interactions: Prospects who have interacted with sales professionals on social media show a 40% higher close rate on sales calls.
Training and Tools:
- Social Selling Training: Sales reps trained in advanced social selling techniques see a 50% increase in sales leads.
- Tools and CRM Integration: Utilizing CRM tools that integrate social media interactions can improve sales tracking and results analysis, enhancing follow-up strategies by 30%.
Market Trends and Buyer Behavior:
- B2B Buyers: 84% of C-level and VP-level buyers are influenced by social media interactions in their decision-making process.
- Social Selling Adoption by Industry: Industries such as technology, finance, and pharmaceuticals are leading in the adoption of social selling, correlating with their digital-savvy customer bases.
6. Sales Referral Statistics

Referral Program Adoption and Success:
- General Adoption: Over 60% of sales organizations have formalized referral programs, recognizing their high ROI compared to other sales channels.
- Conversion Rates: Referral leads convert at a 30% higher rate than leads generated from other marketing channels.
Impact on Sales Cycle:
- Sales Cycle Reduction: Leads from referrals typically see a 25% shorter sales cycle because trust is already established through the referring party.
- Customer Lifetime Value (CLV): Customers obtained via referral have a 16% higher lifetime value than those acquired through other means.
Referral Incentives:
- Incentive Effectiveness: Offering incentives for referrals increases the likelihood of receiving a referral by up to 50%. However, the most effective incentives are often non-monetary, such as exclusive services or access to premium content.
- Employee vs. Customer Referrals: While both are valuable, employee referrals lead to quicker close times and higher initial deal sizes, suggesting internal advocacy is particularly potent.
Engagement and Relationship Building:
- Ongoing Engagement: Continuous engagement with existing customers increases referral likelihood by 32%. Regular updates and check-ins can foster a sense of community and loyalty.
- Customer Satisfaction and Referrals: A customer who rates their satisfaction level as 'high' is three times more likely to refer than someone who rates it as 'low'.
Sales Training and Awareness:
- Training on Asking for Referrals: Despite the effectiveness of referrals, only 11% of salespeople ask for them consistently. Sales training programs that include techniques for requesting referrals can increase this behavior significantly.
- Awareness and Visibility: Enhancing the visibility of a referral program through multiple channels can increase participation rates by up to 70%.
Technology and Tools:
- CRM Integration: Integrating referral tracking into CRM systems helps maintain detailed records of referrals and manage follow-ups more efficiently, increasing the conversion rate by 18%.
- Automated Referral Programs: Automation tools that facilitate the referral process see a 53% higher participation rate compared to manually managed programs.
7. Sales Email Statistics

Email Open and Response Rates:
- Open Rates: The average open rate for sales emails is expected to remain around 21% in 2024, indicating the continuing challenge of standing out in crowded inboxes.
- Response Rates: Sales emails achieve an average response rate of about 3.5%, underscoring the importance of personalization and relevance in email communications.
Personalization and Segmentation:
- Impact of Personalization: Emails that are personalized based on the recipient's behaviors and previous interactions show a 29% higher open rate and 41% higher click rates than non-personalized emails.
- Benefits of Segmentation: Segmented email campaigns report as much as a 760% increase in revenue, demonstrating the effectiveness of targeted content.
Timing and Frequency:
- Best Sending Times: Tuesday mornings at 10 AM are shown to be the most effective time to send sales emails, followed closely by Thursday mornings for maximum engagement.
- Optimal Frequency: Sending 4-5 emails per month to any given prospect maximizes engagement without overwhelming recipients, balancing visibility with respect.
Content and Design:
- Effective Content Types: Emails that include video content see a 96% increase in click-through rate compared to non-video emails.
- Mobile Optimization: With 68% of email opens occurring on a mobile device, mobile-friendly design is no longer optional but a necessity for successful email marketing.
Automated Email Campaigns:
- Automation Success: Automated email campaigns have a 70.5% higher open rate and 152% higher click-through rate compared to standard newsletters.
- Trigger-Based Emails: Triggered emails, such as those sent after a prospect downloads a resource or attends a webinar, boast impressive engagement rates, reinforcing the value of timely, relevant follow-up.
A/B Testing:
- Impact on Performance: A/B testing elements like subject lines, call to actions, and email layout can lead to a 49% increase in email effectiveness.
- Continuous Improvement: Regular A/B testing helps refine approaches based on real-time feedback, ensuring content remains optimally tuned to audience preferences.
Sales Email ROI:
- Return on Investment: For every dollar spent on email marketing, the average return is $42, making it one of the most effective digital marketing channels available.
- Cost-Effectiveness: Email marketing is noted for its cost-effectiveness, especially when compared to other direct marketing methods.
8. Sales Follow up Statistics

Follow-Up Timing and Frequency:
- Immediate Follow-Up: Responding to inquiries within an hour can increase the chance of contact by up to 7 times compared to waiting even 24 hours.
- Persistence Pays Off: 50% of sales happen after the fifth contact, yet the majority of sales reps give up after just one or two follow-ups, highlighting the importance of persistence.
Effectiveness of Different Follow-Up Methods:
- Email vs. Phone: While email follow-ups are convenient and provide a digital record, phone follow-ups have a higher engagement rate, with a success rate of around 10% versus 3% for emails.
- Text Message Follow-Ups: Text messaging has an open rate of 98% and a response rate of 45%, making it an increasingly effective follow-up method, particularly for engaging younger demographics.
Impact on Sales Conversion:
- Conversion Rate Increase: Proper follow-up can increase conversion rates by up to 70%, particularly when personalized and timely.
- Sales Cycle Reduction: Consistent follow-up efforts can reduce the sales cycle duration by 18%, enabling faster closings and increased throughput for sales teams.
Role of Automation in Follow-Up:
- Automated Reminders: Sales teams that utilize CRM systems to automate follow-up reminders see a 30% increase in follow-up rate compliance.
- Sequencing Emails: Automated email sequences that trigger based on customer actions can increase follow-up effectiveness by 22%.
Content of Follow-Up:
- Value Addition: Follow-ups that provide additional value, such as sharing a relevant case study or answering a previously unaddressed question, see a 40% higher engagement rate.
- Personalization: Personalized follow-ups, referencing previous interactions or customized based on customer behavior, result in a 25% higher response rate compared to generic messages.
Customer Perceptions and Preferences:
- Customer Expectations: 80% of customers expect a follow-up within 24 hours of their inquiry, demonstrating the critical nature of timely responses.
- Preference for Frequency: Most customers prefer follow-up contacts to be spaced out over a week, rather than daily, indicating a balance needed between attentiveness and over-contacting.
9. Sales Closing Statistics

Closing Rates and Trends:
- Average Closing Rate: Across industries, the average sales closing rate is about 19%. However, top-performing sales professionals typically achieve closing rates upwards of 30%.
- Industry Variations: Industries such as software and healthcare often exhibit higher closing rates due to the high demand and specific needs of their markets.
Effective Closing Techniques:
- Solution Selling: Sales professionals who focus on solution-based selling, where the emphasis is on solving a specific customer problem, see a 35% higher closing rate than those using traditional feature-based selling techniques.
- Consultative Approach: Adopting a consultative sales approach, where the salesperson acts more as an advisor than a typical sales rep, can boost closing rates by up to 25%.
Role of Sales Enablement Tools:
- CRM Utilization: Teams that effectively use CRM systems to manage customer interactions and sales processes report a 28% improvement in closing rates.
- Sales Automation Tools: Automation tools that assist with scheduling follow-ups, providing timely information, and managing leads can increase closing rates by 18%.
Influence of Multi-Touch Interactions:
- Number of Touches: It often takes between 5 to 7 interactions with a prospect before successfully closing a sale. This underscores the importance of consistent, value-added communication throughout the sales cycle.
- Diverse Communication Channels: Using a combination of emails, phone calls, and face-to-face meetings can significantly enhance the likelihood of a sale, with a 27% better close rate compared to using a single communication method.
Impact of Follow-Up Timing:
- Follow-Up on Proposals: Sales teams that follow up on proposals within 24 hours show a closing rate increase of 21% compared to those that wait longer.
- Persistent Follow-Up: Persistently following up with a prospect, even when initial interactions did not result in a sale, can eventually lead to a closing rate increase of up to 15%.
Training and Development:
- Continuous Training: Ongoing training focused on closing techniques and negotiation skills leads to a 30% improvement in closing effectiveness among sales teams.
- Role-Play and Scenario-Based Training: Implementing regular training sessions that simulate different sales scenarios can prepare sales reps for a variety of customer interactions, improving their confidence and closing abilities.
Customer Decisions and Objections:
- Handling Objections: Sales reps who are trained to effectively handle objections have a 40% higher chance of closing a deal.
- Decision-Making Factors: Over 80% of customers state that a salesperson's ability to directly address their needs and clearly explain how a service or product meets those needs is crucial in their decision-making process.
10. Lead Nurturing and Qualification Statistics
Effectiveness of Lead Nurturing:
- Nurturing Success: Companies that excel in lead nurturing generate 50% more sales-ready leads at a 33% lower cost per lead.
- Revenue Impact: Businesses that focus on nurturing leads see a 20% increase in sales opportunities compared to non-nurtured prospects.
Lead Qualification Efficiency:
- Lead Conversion Rates: Properly qualified leads have a 60% higher conversion rate than unqualified leads. Effective qualification helps focus efforts on the most promising prospects.
- Qualification Criteria Effectiveness: Sales teams using a clear set of qualification criteria, such as BANT (Budget, Authority, Need, Timeline), report a 25% increase in achieving their sales quotas.
Impact of Automation on Lead Nurturing:
- Automation Adoption: 77% of top-performing companies use marketing automation to streamline lead nurturing processes.
- Behavior-Based Emailing: Automated emails triggered by specific behaviors are 3 times more likely to receive engagement than generic emails.
Multi-Channel Nurturing Strategies:
- Channel Effectiveness: Integrating multiple channels into the lead nurturing process increases the chance of contact by 58%. Channels include email, social media, personalized web content, and direct mail.
- Social Media Impact: Sales teams that incorporate social media into their lead nurturing strategies see a 45% lift in lead generation over those that do not.
Time and Frequency of Nurturing Contacts:
- Optimal Contact Frequency: The best results are seen when leads are contacted at least once every 14 days. This frequency keeps your brand top-of-mind without overwhelming the prospect.
- Timing for Follow-Ups: Immediate follow-up on leads, especially those from web downloads or webinar attendances, can increase conversion rates by up to 40%.
Content Personalization in Nurturing:
- Personalization Benefits: Personalized email content increases the click-through rate by 14% and conversion rates by 10%.
- Dynamic Content: Using dynamic content tailored to the lead’s engagement pattern increases the likelihood of moving the lead through the sales funnel by 72%.
Lead Scoring Impact:
- Scoring and Prioritization: Companies employing advanced lead scoring models are 33% more likely to report successful lead nurturing campaigns.
- Behavioral Scoring: Adding behavioral data into the lead scoring system increases the accuracy of scoring by 45%, allowing for more targeted nurturing efforts.
Training and Skills Development for Sales Teams:
- Nurturing Skills Training: Sales teams trained specifically in lead nurturing techniques see a 47% higher average order value than those not trained.
- Qualification Training Impact: Continuous training on lead qualification improves the quality of pipeline development by 40%, directly impacting the bottom line.
11. Sales Productivity Statistics

Time Management and Resource Allocation:
- Time Spent Selling: On average, sales reps spend only 34% of their time actually selling, while the remainder is consumed by administrative tasks and meetings.
- Improving Efficiency: Companies that implement time management training and tools report a 20% increase in sales productivity.
Technology and Automation:
- CRM Utilization: 87% of high-performing sales teams use a CRM system to streamline their sales processes and improve productivity.
- Automation Impact: Sales teams that adopt automation tools for repetitive tasks like data entry and scheduling see a 15% increase in total sales output.
Performance Metrics and Analytics:
- Data-Driven Decisions: Teams that leverage analytics for sales decisions have seen a 25% year-over-year increase in revenue.
- Key Performance Indicators (KPIs): Effective use of KPIs such as call-to-close ratios and customer engagement levels correlates with a 30% improvement in sales productivity.
Sales Training and Development:
- Impact of Continuous Training: Continuous professional development and training can boost sales rep productivity by up to 50%.
- Adoption of New Skills: Sales teams that regularly update their selling techniques and product knowledge report a 35% higher efficiency rate compared to those with outdated skills.
Mobile and Remote Selling:
- Mobile Sales Enablement: Sales reps who use mobile tools for sales activities achieve a 25% higher productivity rate.
- Remote Work Effectiveness: Sales teams with access to remote working tools report a 28% increase in productivity, as they can manage more customer interactions flexibly.
Lead Generation and Follow-Up Efficiency:
- Lead Response Time: Responding to leads within 5 minutes can increase the likelihood of a sale by 21 times compared to slower responses.
- Follow-Up Strategies: Persistent follow-ups, particularly automated follow-ups tailored to customer actions, can boost conversion rates by 18%.
Team Collaboration and Communication:
- Collaborative Tools: Teams that use collaborative platforms for sharing insights and strategies see a 23% higher productivity level.
- Internal Communication: Efficient internal communication practices are associated with a 17% increase in overall sales performance.
Customer Relationship Management:
- Long-Term Engagement: Maintaining regular contact with existing customers can increase sales productivity by 22% due to higher retention and upsell opportunities.
- Customer Satisfaction: High levels of customer satisfaction are directly linked to a 20% increase in sales productivity, as satisfied customers are more likely to repurchase and refer new clients.
12. B2B Sales Statistics for Sales Professionals
Sales Cycle Duration:
- Average Sales Cycle: The typical B2B sales cycle now ranges from 6 to 9 months, largely due to more stakeholders being involved in the buying process.
- Impact of Digital Tools: Companies utilizing digital sales tools have seen a reduction of up to 30% in their sales cycle length.
Decision-Maker Dynamics:
- Number of Decision-Makers: On average, B2B sales deals now involve 6 to 10 decision-makers, each from different departments or functions.
- Consensus Building: Sales strategies that effectively address the needs and concerns of all decision-makers can increase closing rates by over 20%.
Role of Content Marketing:
- Content Influence: 70% of B2B buyers fully define their needs before engaging with a sales representative, and 44% identify specific solutions before reaching out.
- Effective Content Types: White papers and case studies are the most effective types of content for moving B2B buyers through the sales funnel, influencing over 60% of purchase decisions.
Digital and Social Selling:
- Social Media Impact: 84% of C-level and VP-level buyers use social media and content to support their purchase decisions.
- LinkedIn Effectiveness: LinkedIn is the most effective social platform for B2B marketers, with 80% of B2B leads generated through social media coming from LinkedIn.
Customer Acquisition and Retention:
- Acquisition Costs: It costs five times as much to acquire a new customer than to retain an existing one in the B2B space.
- Retention Impact: Increasing customer retention rates by 5% increases profits by 25% to 95%.
Technology Adoption:
- CRM Usage: 91% of B2B companies with 10 or more employees use CRM systems to streamline their sales processes.
- AI Integration: B2B sales teams integrating AI into their CRM systems report up to a 50% increase in leads and appointments.
Sales Training and Performance:
- Training ROI: B2B organizations that invest in comprehensive sales training programs see a 24% higher profit margin on average.
- Ongoing Training: Continuous training correlates with a 34% improvement in team sales performance.
Lead Generation and Qualification:
- Quality vs. Quantity: High-quality leads are the top priority for B2B marketers, with a focus on lead quality increasing conversion rates by up to 70%.
- Lead Scoring: Effective lead scoring models can improve alignment between marketing and sales, boosting sales productivity by up to 15%.
13. Inbound and Outbound Sales Statistics

Inbound Sales Statistics
Lead Conversion Rates:
- Conversion Effectiveness: Inbound strategies convert leads into customers at a 14% higher rate than outbound strategies, largely due to the self-selecting nature of incoming leads.
- SEO and Content Impact: Businesses focusing on SEO and high-quality content generation report a 15% increase in inbound lead quality and conversion rates.
Cost Efficiency:
- Lower Cost Per Lead: Inbound leads cost 61% less on average than outbound leads, making inbound strategies highly cost-effective for businesses looking to optimize their marketing budgets.
- ROI on Content Marketing: Companies investing in content marketing see an average return on investment that is 3 times higher than traditional outbound methods.
Buyer Journey Engagement:
- Early Engagement: 68% of B2B customers prefer to conduct online research independently before engaging with a sales representative.
- Content Interaction: 95% of buyers choose a solution provider that offers ample content to navigate through each stage of the buying process.
Outbound Sales Statistics
Direct Interaction and Impact:
- Reach and Engagement: Outbound sales strategies, including cold calling and direct mail, reach potential customers at a rate of 18% effectiveness.
- Event Marketing Effectiveness: 75% of business executives say attending events and participating in direct engagements make it easier to make purchasing decisions.
Sales Cycle Dynamics:
- Sales Cycle Length: Outbound sales cycles are generally longer due to the need for initial contact and engagement, averaging between 6 to 12 months.
- High-Touch Interactions: High-touch outbound strategies are required 20% more often to close deals, particularly in industries like technology and manufacturing.
Investment and Returns:
- Budget Allocation: Companies spend approximately 39% of their marketing budget on outbound marketing techniques.
- Immediate Feedback: Outbound strategies provide immediate feedback and metrics on customer interest and campaign effectiveness.
Training and Skill Development:
- Skill Requirement: Outbound sales require a high level of skill in persuasion and cold calling techniques. Training in these areas can increase outbound sales effectiveness by up to 50%.
- Persistence and Follow-up: Successful outbound campaigns require an average of 8 follow-up calls after the initial contact, compared to only 5 for inbound strategies.
14. Sales Success Statistics
Sales Performance and Goals Achievement:
- Goal Achievement Rates: Approximately 68% of salespeople meet or exceed their annual sales goals, a critical metric that distinguishes high performers from the average.
- Impact of Alignment: Companies with tightly aligned sales and marketing teams achieve 24% faster three-year revenue growth and 27% faster three-year profit growth.
High Performing Sales Teams:
- Team Composition: High-performing sales teams are 35% more likely to emphasize strategic account planning as a key skill, leading to better client relationships and increased sales.
- Adoption of Sales Enablement Tools: Teams that utilize advanced sales enablement platforms show a 15% higher sales success rate compared to those using basic or no platforms.
Sales Training and Development:
- Continuous Training: Organizations that invest in continuous training for their sales staff see a 50% higher net sales per employee.
- Training ROI: Effective sales training can boost an individual salesperson’s performance by up to 20% and increase employee engagement and retention.
Customer-Centric Selling Approaches:
- Customer Retention Rates: A 5% increase in customer retention correlates to at least a 25% increase in profit, underlining the importance of nurturing existing customer relationships.
- Understanding Customer Needs: 82% of buyers accept meetings with salespeople who proactively address their current challenges and pain points.
Use of CRM and Data Analytics:
- CRM Utilization: Sales teams that effectively use CRM software can improve their productivity by up to 34% and sales forecast accuracy by 42%.
- Data-Driven Sales Decisions: Teams that engage in data-driven selling report an average of 23% higher acquisition rates and a 6% higher profit margin.
Lead Generation and Management:
- Quality Over Quantity: The top 1% of B2B marketers focus on generating leads that are of high quality rather than high quantity, which is reflected in their 200% higher lead conversion rates.
- Lead Response Times: Rapid response to sales leads (within 1 hour) increases conversion rates by 7x compared to slower response times.
Technology and Innovation in Sales:
- Artificial Intelligence: Sales teams using AI and machine learning for sales forecasting, customer insights, and pricing optimization report a 30% increase in lead conversion rates.
- Mobile Sales Tools: 65% of sales professionals who use mobile CRM achieve their sales quotas, as opposed to only 22% of those who do not.
Social Selling Efficacy:
- Social Selling Adoption: 78% of salespeople engaged in social selling outsell their peers who don’t use social media.
- LinkedIn as a Sales Tool: Sales professionals who excel in social selling create 45% more opportunities than their peers and are 51% more likely to hit their sales quotas.
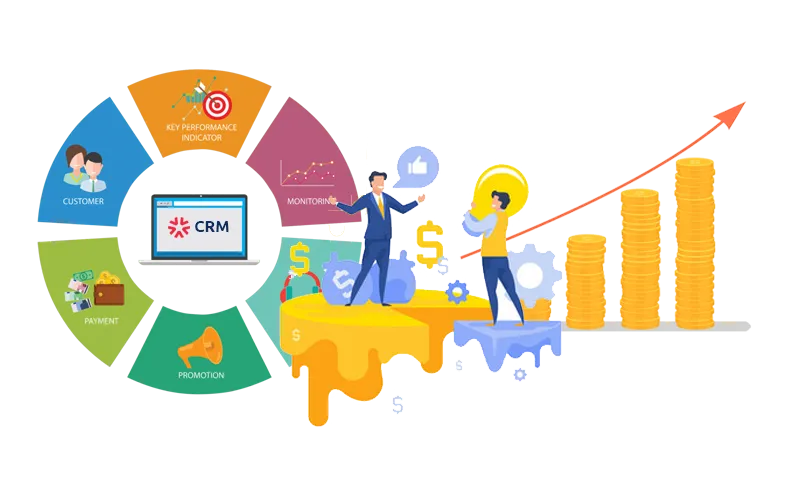
15. Sales CRM Statistics for Sales Reps
Adoption and Utilization:
- CRM Adoption Rates: Over 91% of companies with more than 11 employees now use CRM systems to manage customer relationships and sales processes.
- Market Growth: The CRM software market is expected to grow by 14% annually, highlighting its critical role in modern sales strategies.
Impact on Sales Performance:
- Sales Productivity: Companies that use CRM systems report a 34% increase in sales productivity. This is often attributed to improved data access and management capabilities.
- Revenue Increase: Businesses utilizing CRM can see revenue increases of up to 41% per salesperson due to enhanced lead management and prioritization.
Efficiency in Sales Processes:
- Data Accessibility: 74% of CRM users say their CRM system gives them improved access to customer data, significantly enhancing their sales efforts.
- Lead Conversion: CRM systems help increase sales conversion rates by 300%, showcasing their effectiveness in managing the sales pipeline and nurturing leads.
Customer Retention and Satisfaction:
- Customer Retention: Effective use of a CRM system can improve customer retention rates by up to 27%.
- Enhanced Customer Service: 47% of CRM users noted a significant impact on customer satisfaction and service, primarily due to better responsiveness and personalized service.
Automation and Time Savings:
- Task Automation: CRM automation frees up to 30% of sales agents' time by automating routine tasks such as data entry, follow-ups, and reporting.
- Reduced Sales Cycles: Automation features within CRMs can reduce sales cycles by 8-14%, enabling faster deal closures.
Analytics and Forecasting:
- Sales Forecasting Accuracy: CRMs can increase sales forecasting accuracy by up to 42%, helping sales teams to plan more effectively and allocate resources efficiently.
- Customer Behavior Insights: Advanced CRM analytics provide deep insights into customer behaviors, preferences, and trends, allowing sales teams to tailor their approaches accordingly.
Integration with Other Tools:
- Tool Integration: 52% of CRM users utilize their CRM to integrate with other marketing or sales technologies, enhancing overall system cohesion and data sharing.
- Impact on Marketing ROI: Integrating CRM with marketing automation tools has shown to increase marketing ROI by up to 32%.
Mobile CRM Benefits:
- Mobile Accessibility: Sales representatives who access CRM from mobile devices increase their sales achievement rates by 65% compared to those who do not.
- Real-Time Data Access: 50% of teams improved their productivity by using mobile CRM, which provides real-time access to customer data and interactions.
Actionable Sales Statistics You Should Use in 2024

How Sales Statistics Can Change Your Sales Process and Empower Your Sales Teams

Sales statistics can significantly enhance your sales process by providing data-driven insights that lead to more informed decision-making. By analyzing these statistics, you can identify trends, understand customer behaviors, and measure the effectiveness of different sales strategies. This allows you to optimize your approach and allocate resources more efficiently.
For your sales team, access to detailed sales data empowers them to target their efforts more effectively, tailor their interactions based on customer preferences, and close deals faster. Incorporating these insights into your sales strategy not only boosts the performance of individual team members but also enhances the overall productivity and success of your sales team.
Concluding Thoughts
In wrapping up our exploration, it’s clear that harnessing these insights provides a significant competitive edge. From fine-tuning sales strategies to enhancing performance across various sales processes, the use of data is invaluable. As the landscape of sales continues to evolve, staying informed through key metrics will empower sales teams to not only meet but exceed their targets, ensuring sustained success in a highly competitive market. This understanding is essential for any business looking to thrive in 2024 and beyond.
Further Reading
To further deepen your knowledge and skills in sales, consider delving into additional resources available on our blog. These articles are specifically tailored to enhance your understanding of key sales concepts and provide you with actionable strategies to optimize your sales process:
- Exploring Sales Lead Generation: Uncover effective strategies to enhance your lead generation efforts. This piece offers valuable insights into creating a robust pipeline to ensure a steady flow of qualified leads. Read more about sales lead generation.
- Understanding B2B Sales Dynamics: Dive into the complexities of B2B sales and discover tactics that can help you navigate this challenging landscape. This article breaks down effective approaches tailored for the B2B market. Learn more about B2B sales strategies.
- Lead Generation Techniques: Gain a deeper understanding of lead generation with a focus on innovative methods that attract and convert prospects. This resource is crucial for sales teams looking to improve their lead acquisition strategies. Explore lead generation methods.
- The Difference Between Sales and Marketing: Clarify the distinct roles of sales and marketing in business growth and why understanding both is crucial for success. This article helps align your marketing efforts with sales goals to drive better results. Understand the sales and marketing dynamic.
- How to Use Sales Navigator Effectively: Master the tools and techniques of LinkedIn's Sales Navigator to enhance your prospecting activities. This guide provides practical tips for leveraging this powerful platform to its fullest potential. Get tips on using Sales Navigator.
These resources offer a comprehensive look at modern sales techniques and strategies, providing you with the tools needed to boost your sales efficiency and effectiveness. Whether you're new to sales or looking to refine your existing skills, these articles serve as a valuable addition to your sales mastery toolkit.